Ryanair is a wonderful example of two extremes - it’s one of the worst possible airlines that nickel and dimes you for everything, it’s not a great employer, and it is rated the worst European airline; however, it’s dirt cheap.
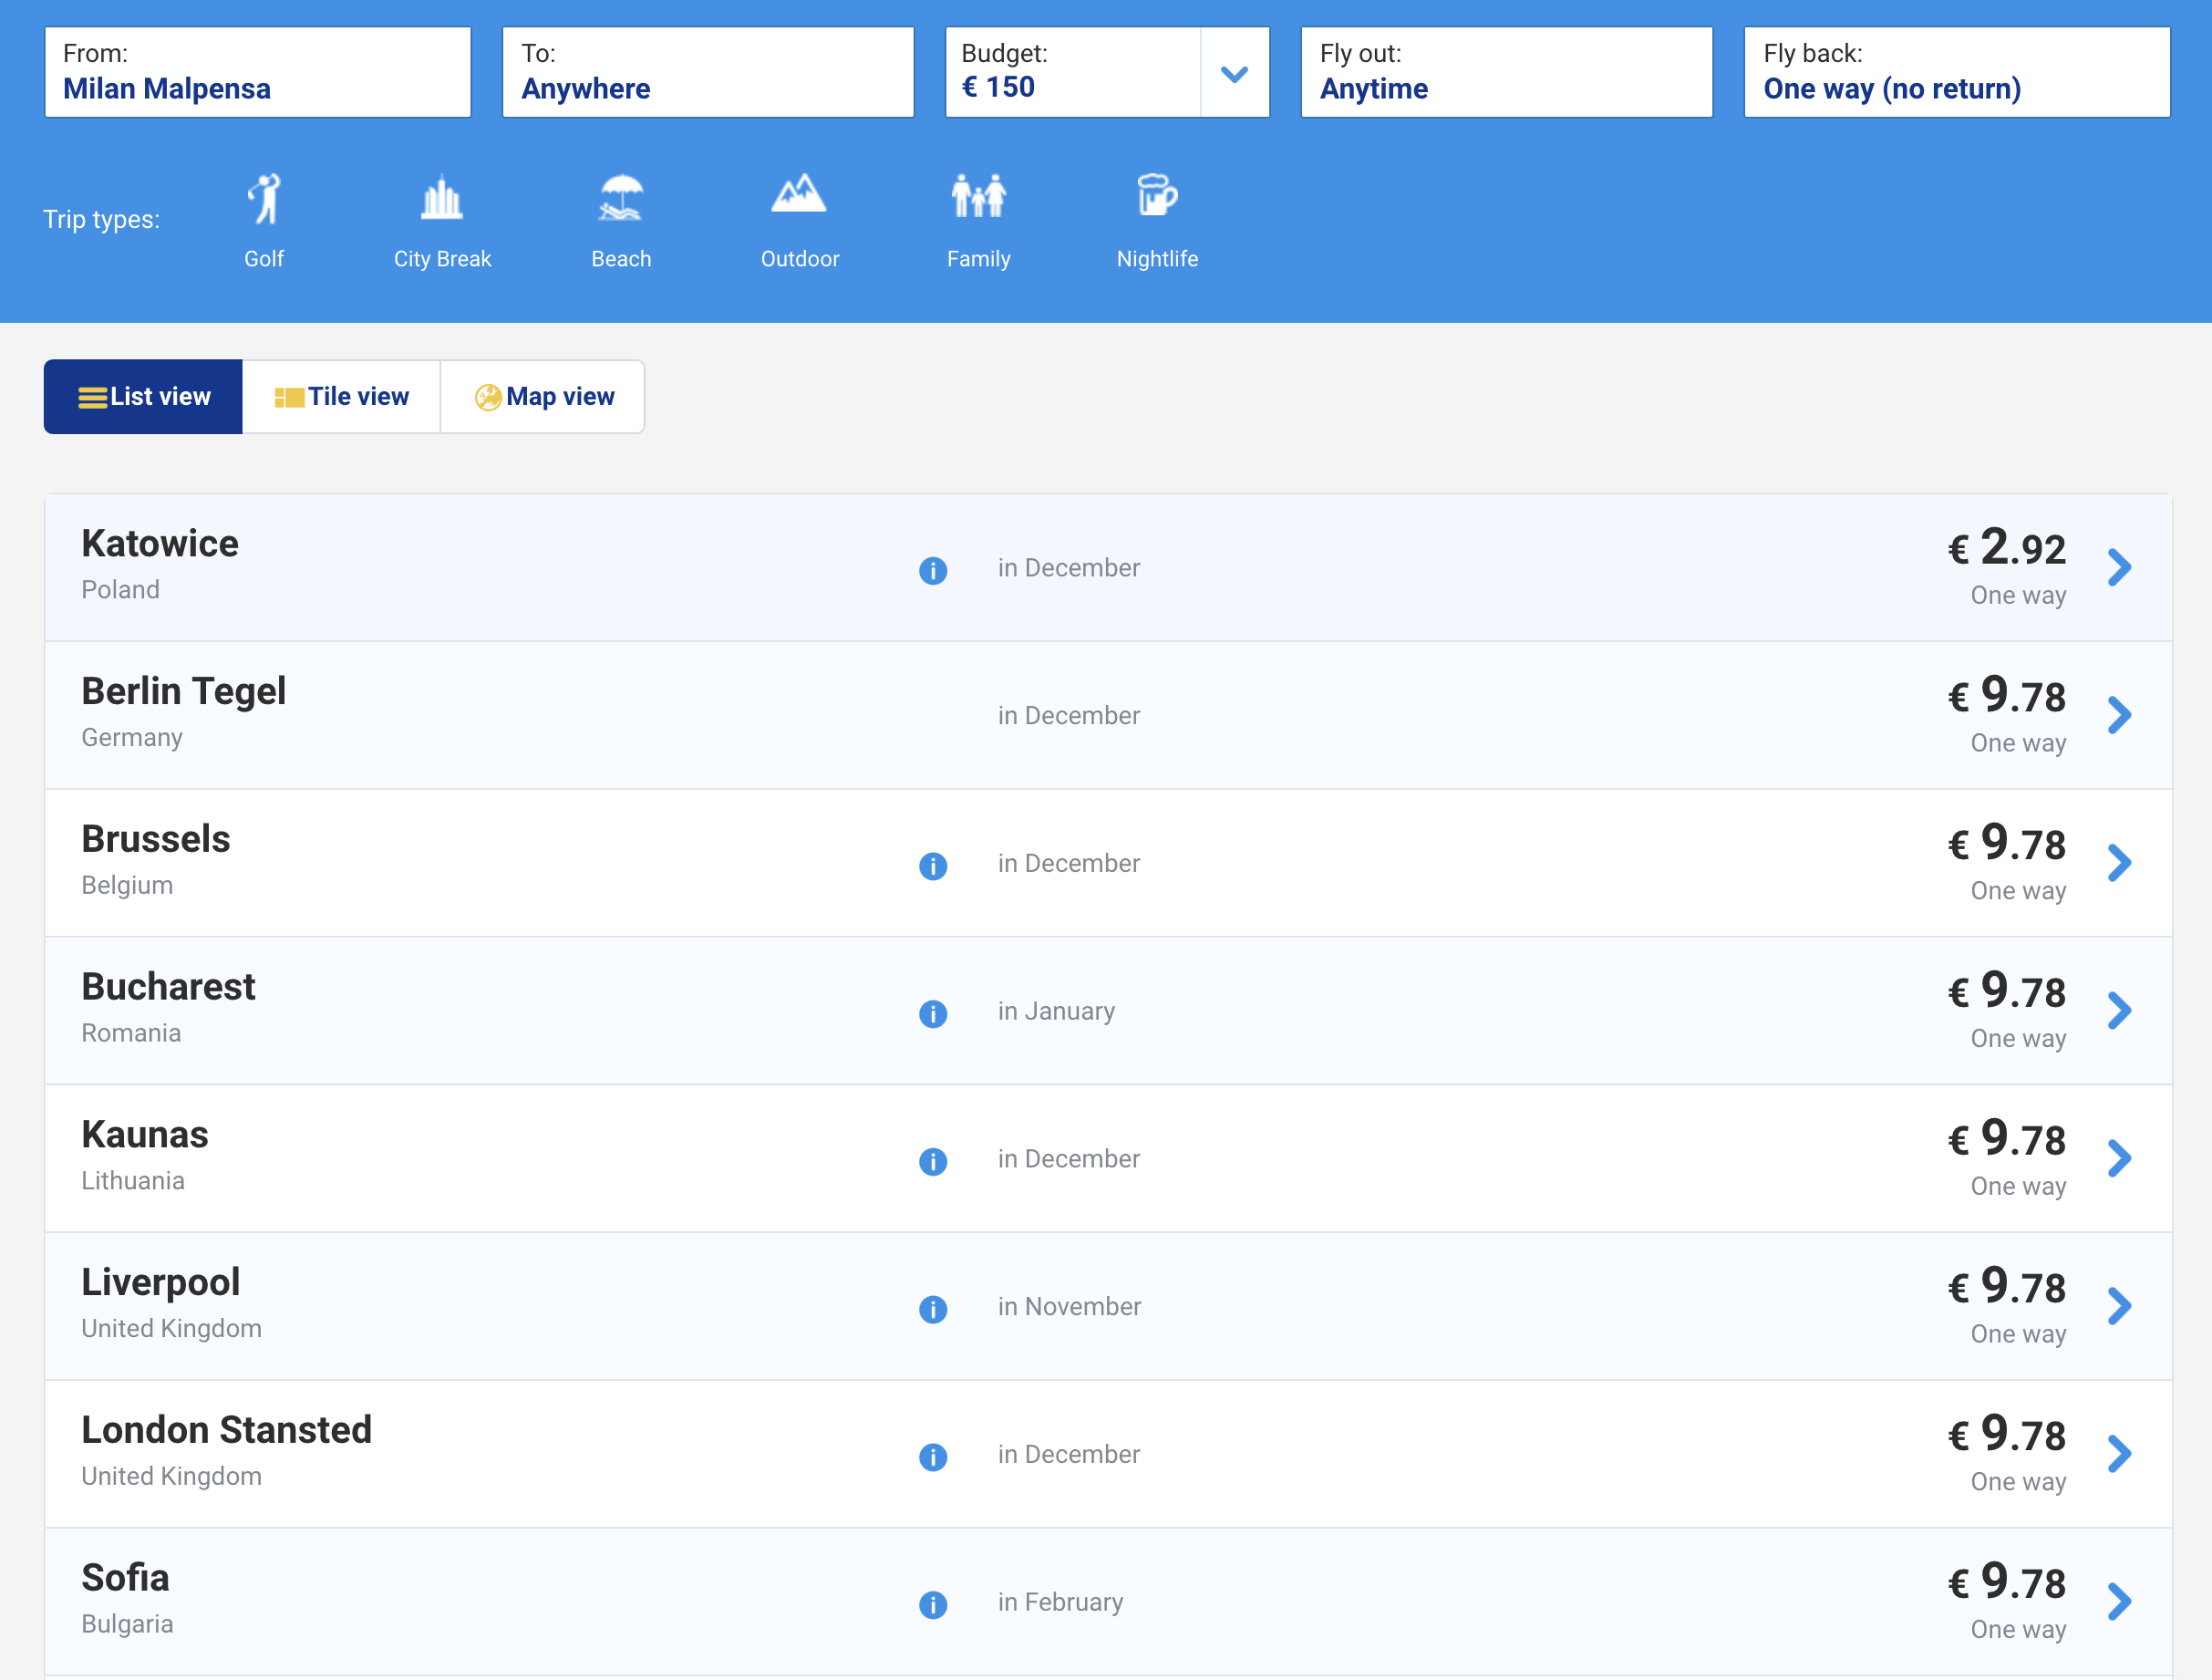
Ryanair flight prices
Flight prices around Christmas time out of Milan
Some friends and I wanted to take a trip out of Venice right before Christmas. We did not want to do a single round trip, though - we wanted to do a multi leg journey. The problem with Ryanair’s site, however, is that it only lets you make a single round trip itinerary. This is great for round trip flights to a single destination, but means that it’s a significant amount of work to cross reference which city goes where. If my flight plan is Airport A -> Airport B -> Airport C -> Airport A there’s no way to check that B -> C -> A is a valid journey without checking both the B -> C segment and the C -> A segment.
For instance, our first thought was to go to Berlin. Great - Ryanair has a nonstop from Venice Treviso to Berlin Schönefeld. If we want to add another leg of the trip, which then proceeds to return to Venice Treviso, we’d need to manually go through each of the airports that Berlin flies to and see if that airport flew to Venice.
We could model the relationship between airports as a graph, and then look for a cycle in the graph of size 3, with two nodes we already know.
The first step was to actually get the data from their site.
Inspecting their site
I was hoping for an XHR request that retrieved a full list of airports in JSON format. Unfortunately I wasn’t that lucky, but I got close enough. The HTML contained a lot of ng- attributes, so I knew it was an angular app. Angular will store all variables in the state of a node, so I could just extract it from there.
The front end clearly did some sort of filtering - if you selected a departure airport it would only show you available destinations. I thought I could just find the node’s state and extract it from there.
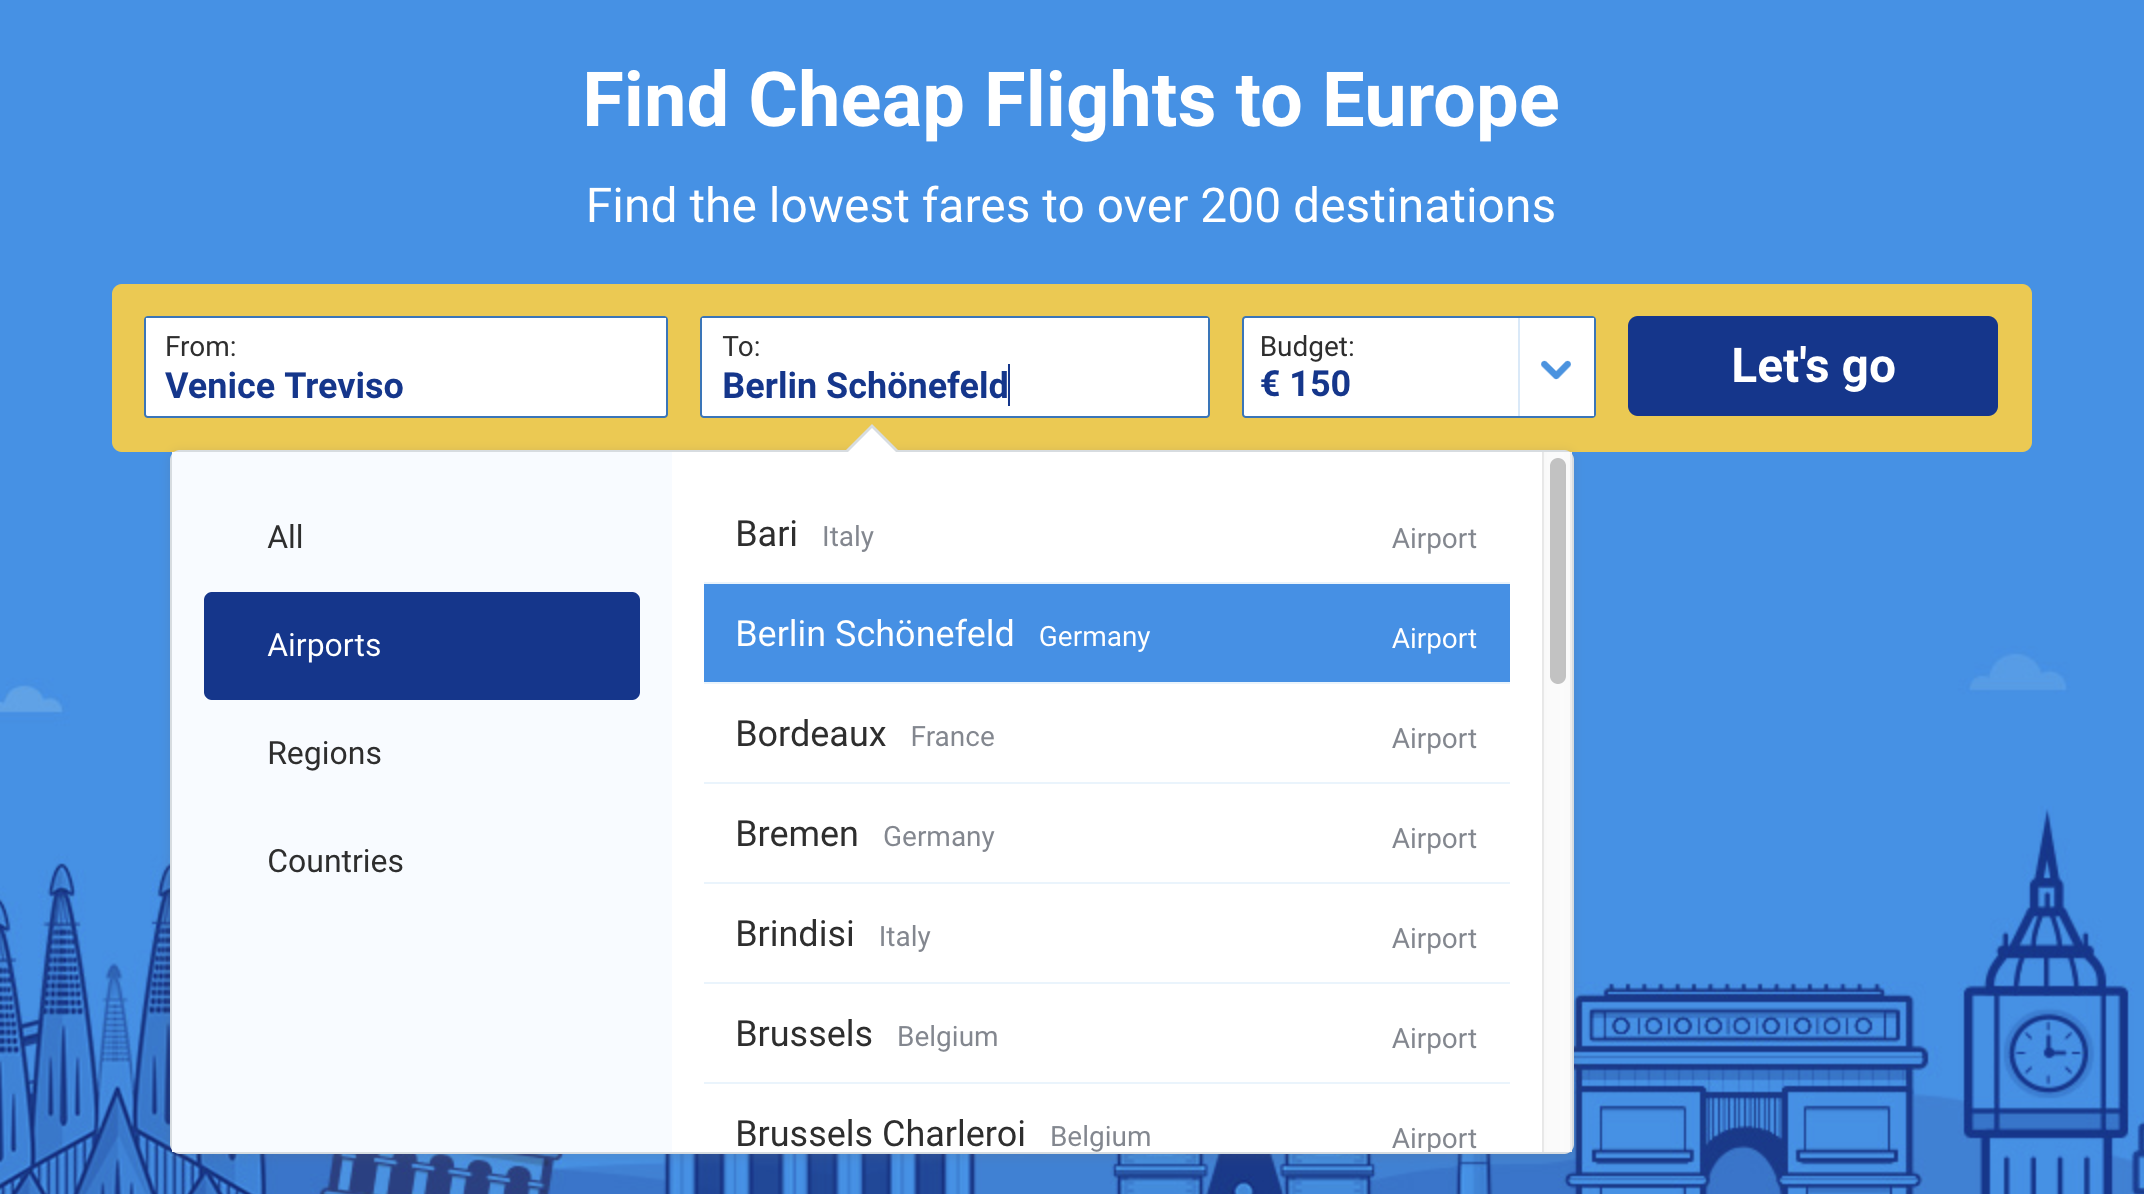
Ryanair filtered prices
Ryanair only shows you available destinations from your airport of choice
I started poking through devtools, using angular to inspect various nodes’ state. In the HTML for the destination picker there was a normal ng-repeat that iterated over a local variable allAirportsList in a destinationPicker object.
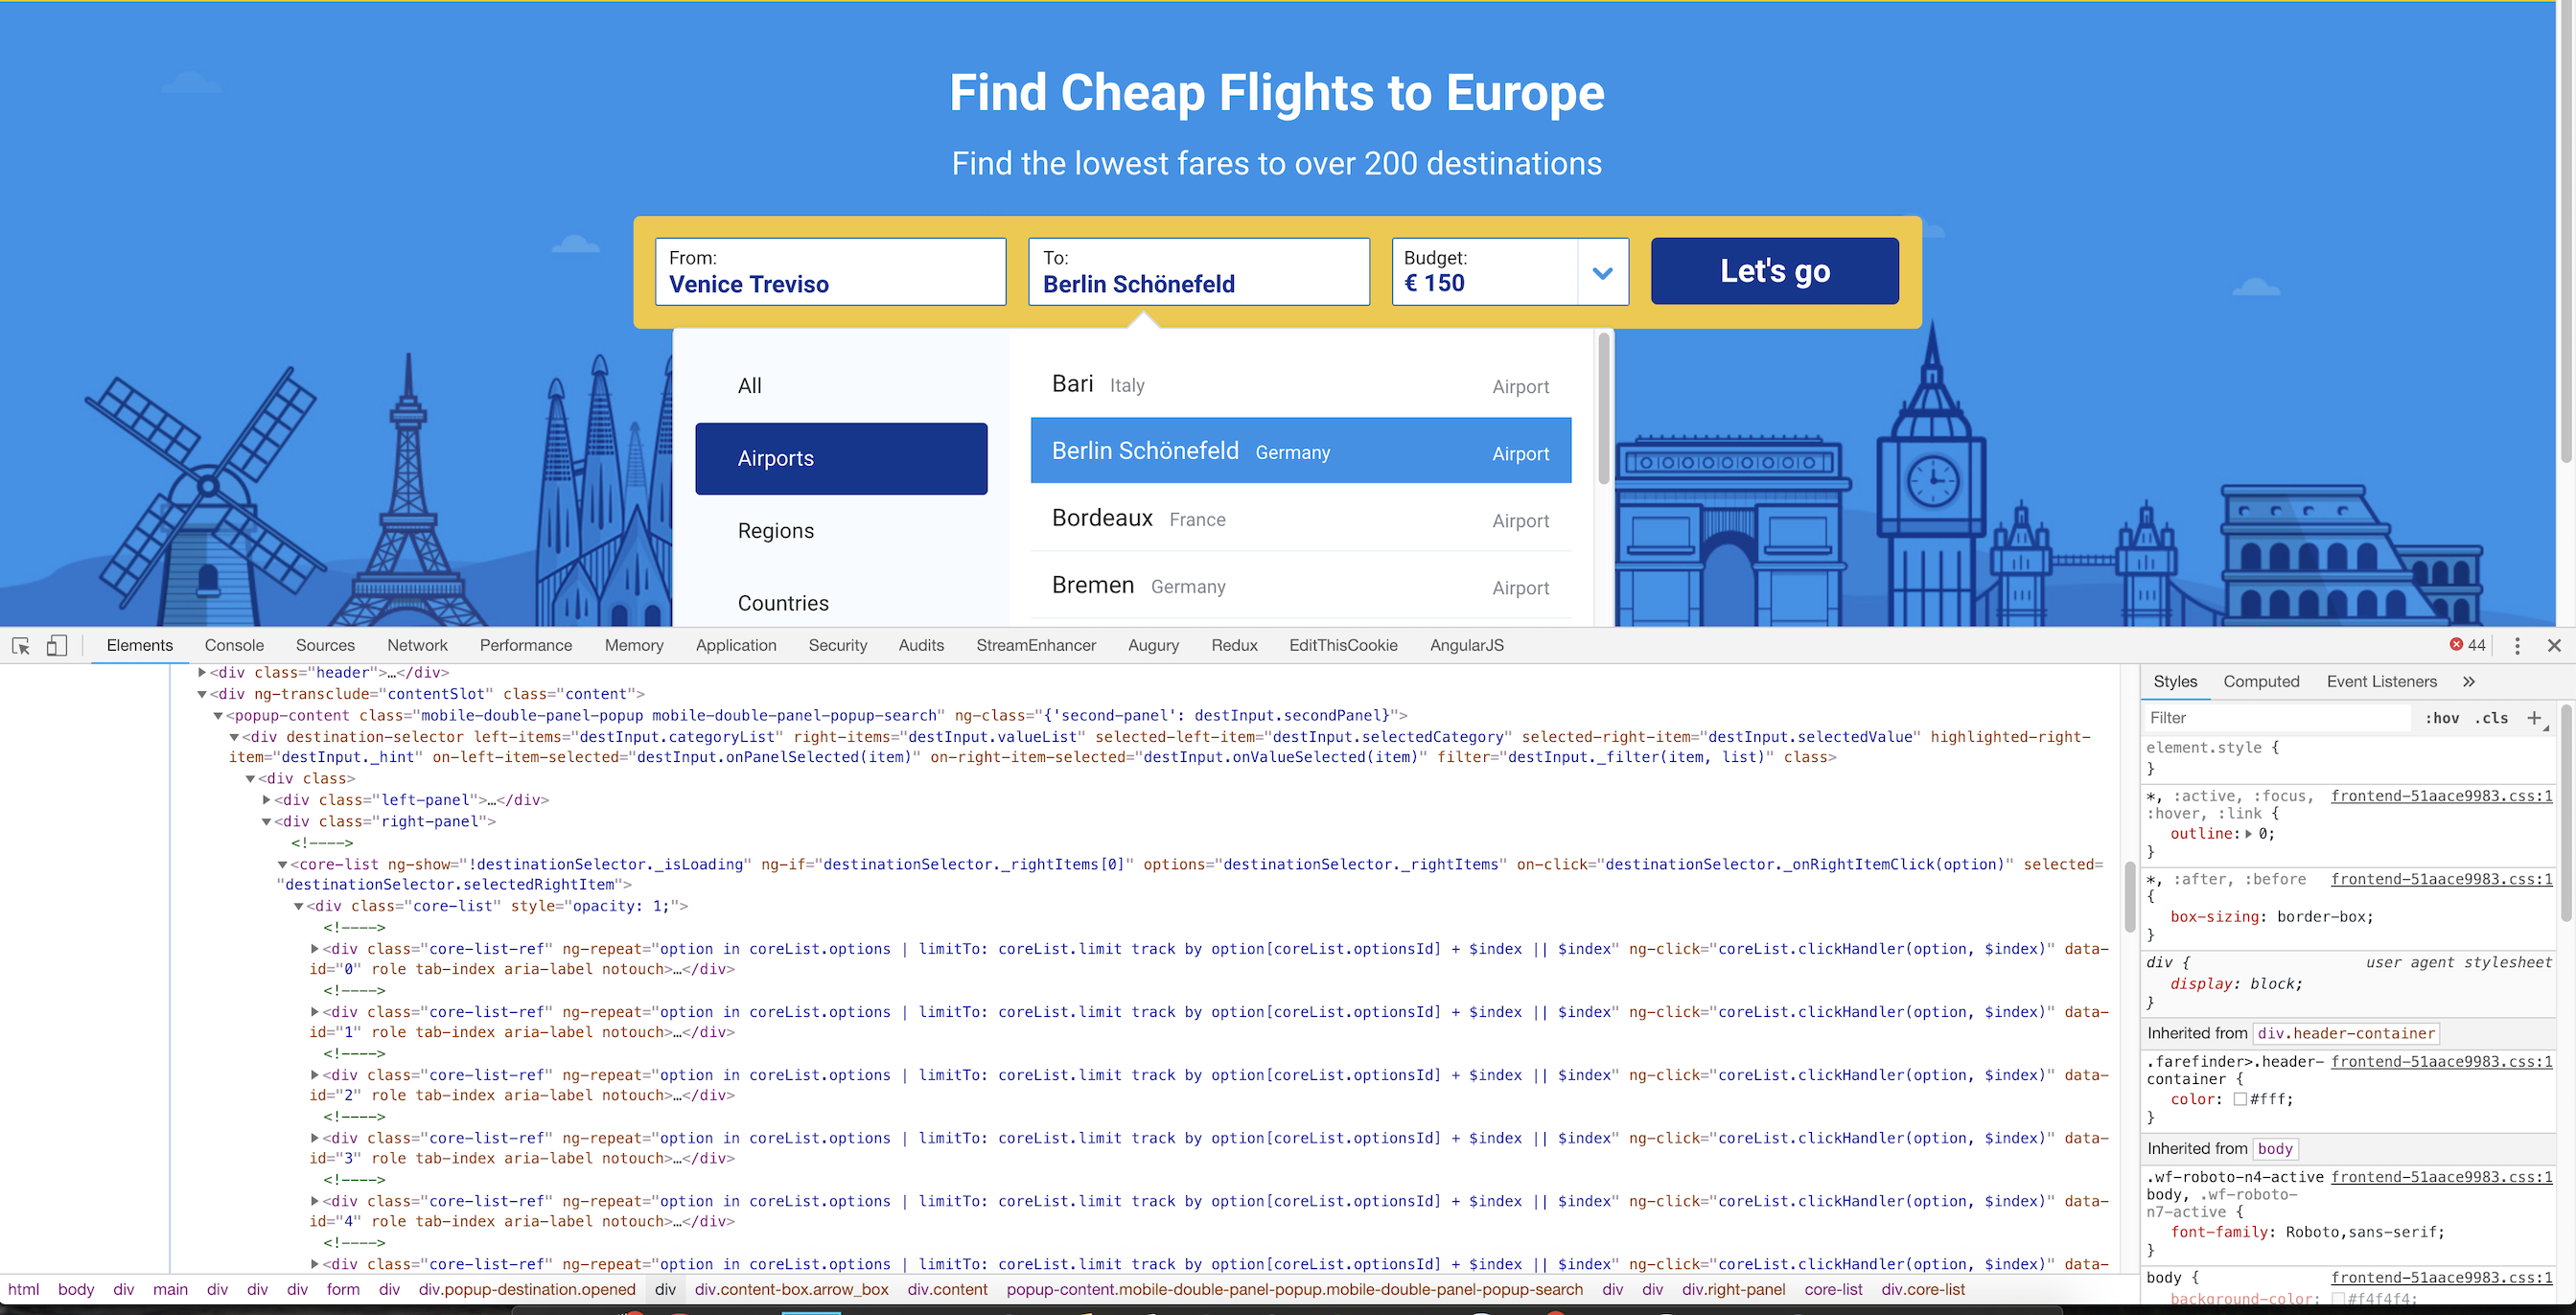
Ryanair filtered HTML
There was a coreList state variable
I traversed down the state tree until I found the allAirportsList property, which contained all the airport keys and the locations to which they flew. I extracted this state (over 1MB of route information) and could now build a graph representation of airport connections.
Building out a graph model
First I had to store the information in a method that would be easily parsed and converted into a graph. The easiest would be to just have a map in which every key (an airport IATA code) was a set of all the airports that it could fly to.
let mappings = {};
let airportCodes = [];
for (const airport of airports.allAirportsList) {
  let id = airport.id; //format airport:XYZ
  let ryanairId = id.split(":");
  if (ryanairId[0] === "airport") {
    let iata = ryanairId[1];
    airportCodes.push(iata);
    if (!mappings.hasOwnProperty(iata)) {
      mappings[iata] = new Set();
    }
    let routes = airport.routes.filter((entry) => {
      return entry.startsWith("airport");
    });

    routes = routes.map((entry) => entry.split(":")[1]); // Format airport:XYZ
    routes = routes.map((entry) => entry.split("|")[0]); // Some airports have format airport:XYZ|XYZ City
    for (const route of routes) {
      mappings[iata].add(route);
    }
  }
}
I’m not sure if this is a bidirectional graph - I don’t know if Airport A flying to Airport B means that Airport B also flies to Airport A. For now I’ll keep this as a directed graph.
I decided to use Cytoscape to visualize the results, as I’d used the library before. This visualization will help in the final graph, as it will show all the valid airports.
We could now visualize a graph of every airport and its destinations. This was significantly more than I was expecting - the graph is almost unusable there are so many connections (there are 4223 edges!). We'd need to filter this more to remove all airports that did not satisfy our conditions.
This is a graph that only shows outgoing connections from SXF, Berlin Schonefeld. However, this shows us destinations that might not connect to TSF. We want a list of potential cities that are reachable from Berlin and will fly to TSF, Venice Treviso.
And there we have our graph! All valid connections that go TSF -> SXF -> ??? -> TSF. Any path in the graph above lets us return to TSF, so a depth-first search can compute the full path to every node.
Path
Deciding on cities
The graphs above are a cool visual representation, but our end goal is really just a list of possible voyages - something likeTSF -> SXF -> MLA -> TSF. The full list is here:
- AGP - Malaga, Spain
- BRI - Bari, Italy
- BRU - Brussels, Belgium
- BUD - Budapest, Hungary
- CGN - Cologne, Germany
- CTA - Catania, Italy
- DUB - Dublin, Ireland
- EDI - Edinburgh, United Kingdom
- EMA - East Midlands, United Kingdom
- KRK - Krakow, Poland
- LPA - Gran Canaria, Spain
- MAN - Manchester, United Kingdom
- MLA - Malta, Malta
- OPO - Porto, Portugal
- PMO - Palermo, Italy
- RAK - Marrakesh, Morocco
- SOF - Sofia, Bulgaria
- STN - London Stansted, United Kingdom
- SVQ - Seville, Spain
- SXF - Berlin Schonefeld, Germany
- TFS - Tenerife South, Spain
- VLC - Valencia, Spain
- VNO - Vilnius, Lithuania
Conclusion
This was the first time I’ve used a graph algorithm in a non-academic context, which is pretty cool. It was a fun endeavour that created a tool that will hopefully be useful to some. If you’re looking to plan a super cheap European vacation you can just use this to add all the legs of your Ryanair flights!
A nice future addition would be to somehow get price data for each flight plan. I found their API and it’s pretty straight forward:
curl 'https://api.ryanair.com/farefinder/3/oneWayFares?&departureAirportIataCode=TSF&language=en&limit=16&market=en-gb&offset=0&outboundDepartureDateFrom=2018-10-04&outboundDepartureDateTo=2019-10-26&priceValueTo=150'I might get to that if I find that our N-length trip gets too expensive.
Also I apologize if this webpage was slow or clunky - normally I’m a huge fan of web optimizations, but this blog post needed libraries that are significantly slower than average to show what I wanted to show1.
Footnotes
-
Actually saying they’re slower than average is both true and not true - they are significantly slower than most other libraries, but it’s also because they’re doing work that is significantly more complicated than most front end libraries normally do. I’m not saying Cytoscape isn’t optimized (far from that, it’s an amazing piece of code), it’s just doing things that you would not normally do in JavaScript. ↩